GGPLOT - coord_flip
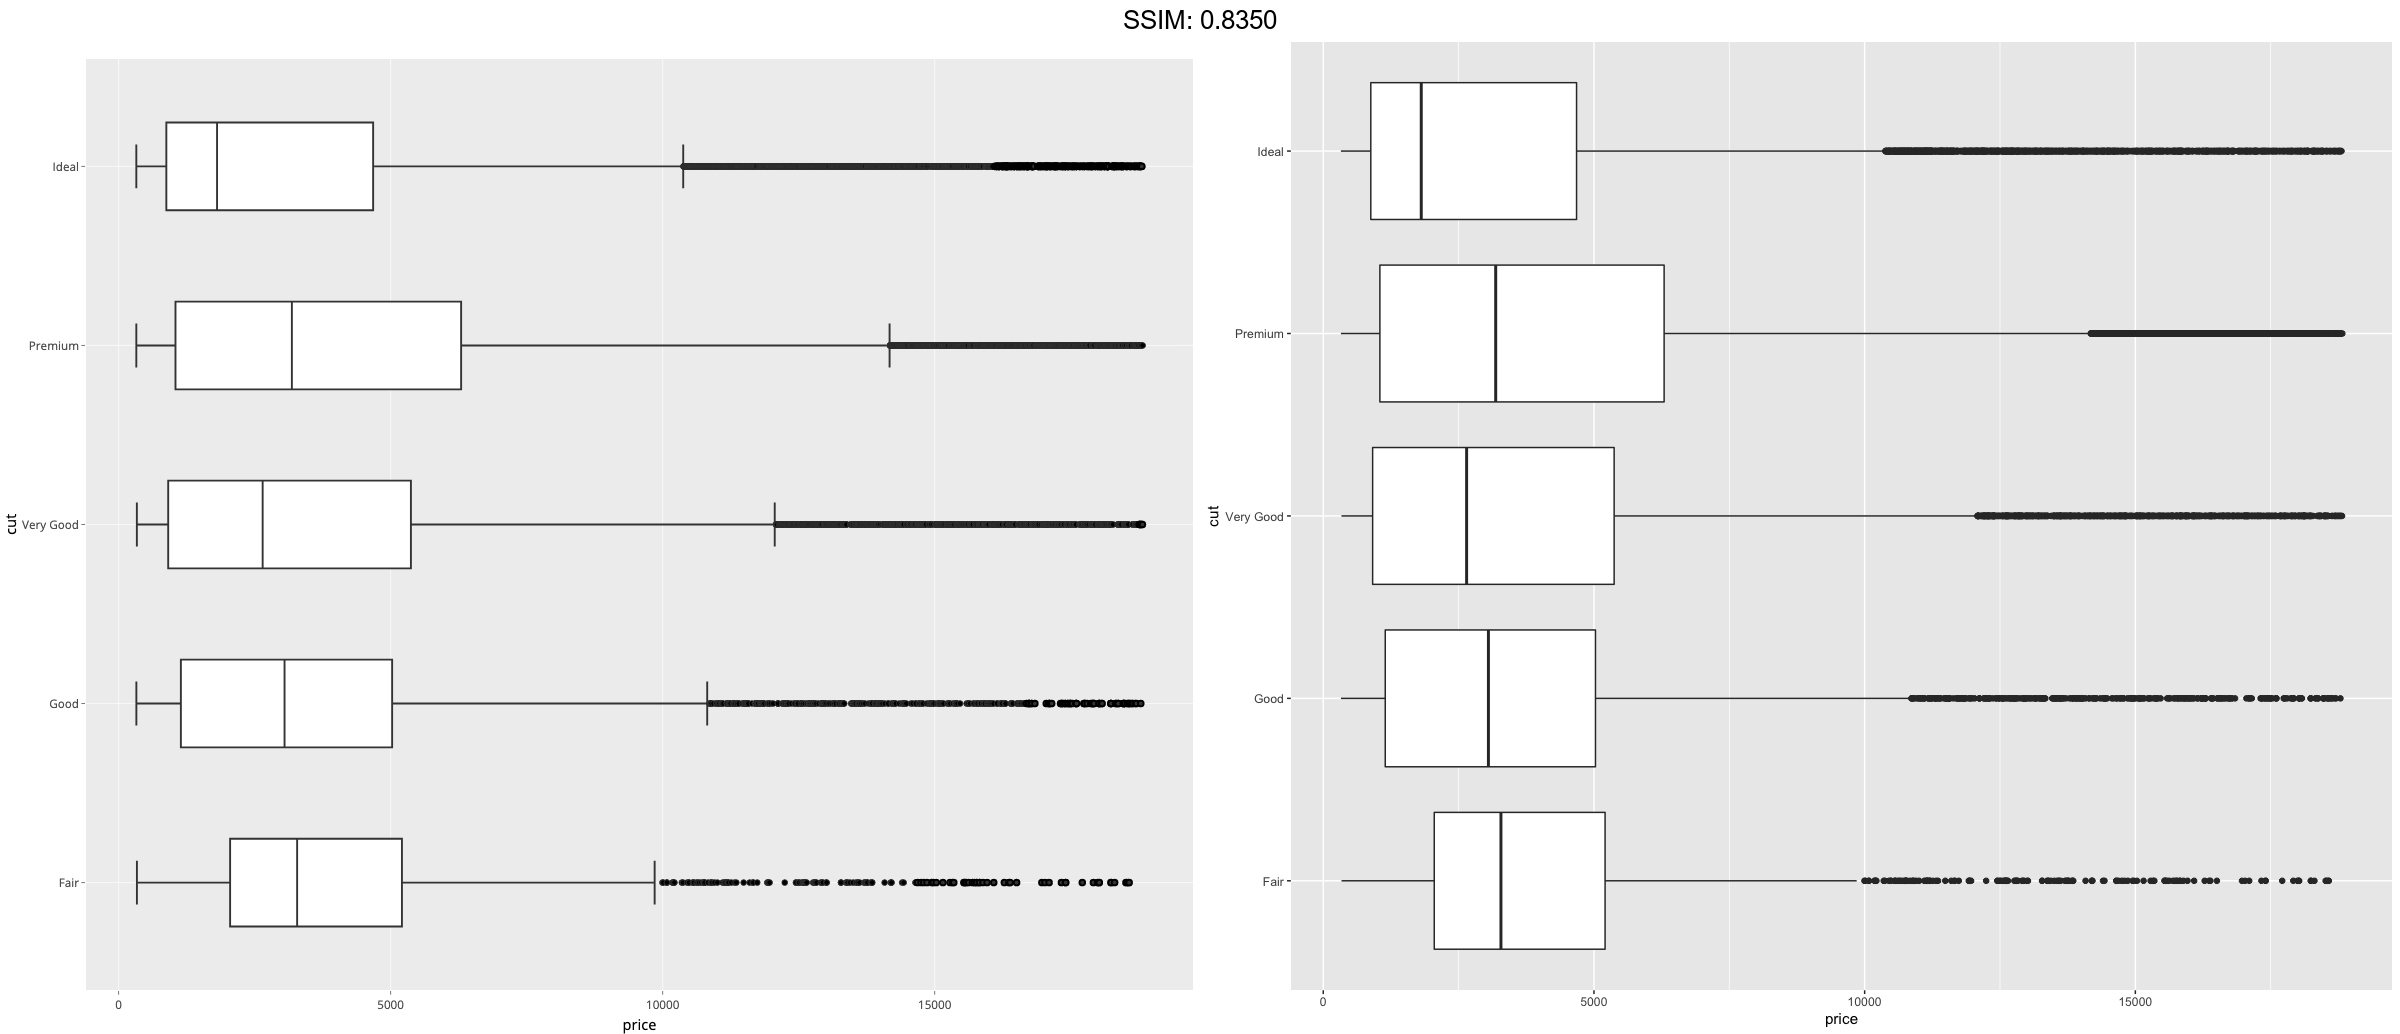
Creates Cartesian coordinates with x and y flipped and then convert them with ggplotly.
p <-
 ggplot(diamonds, aes(cut, price)) +
  geom_boxplot() +
  coord_flip()
plotly::ggplotly(p)


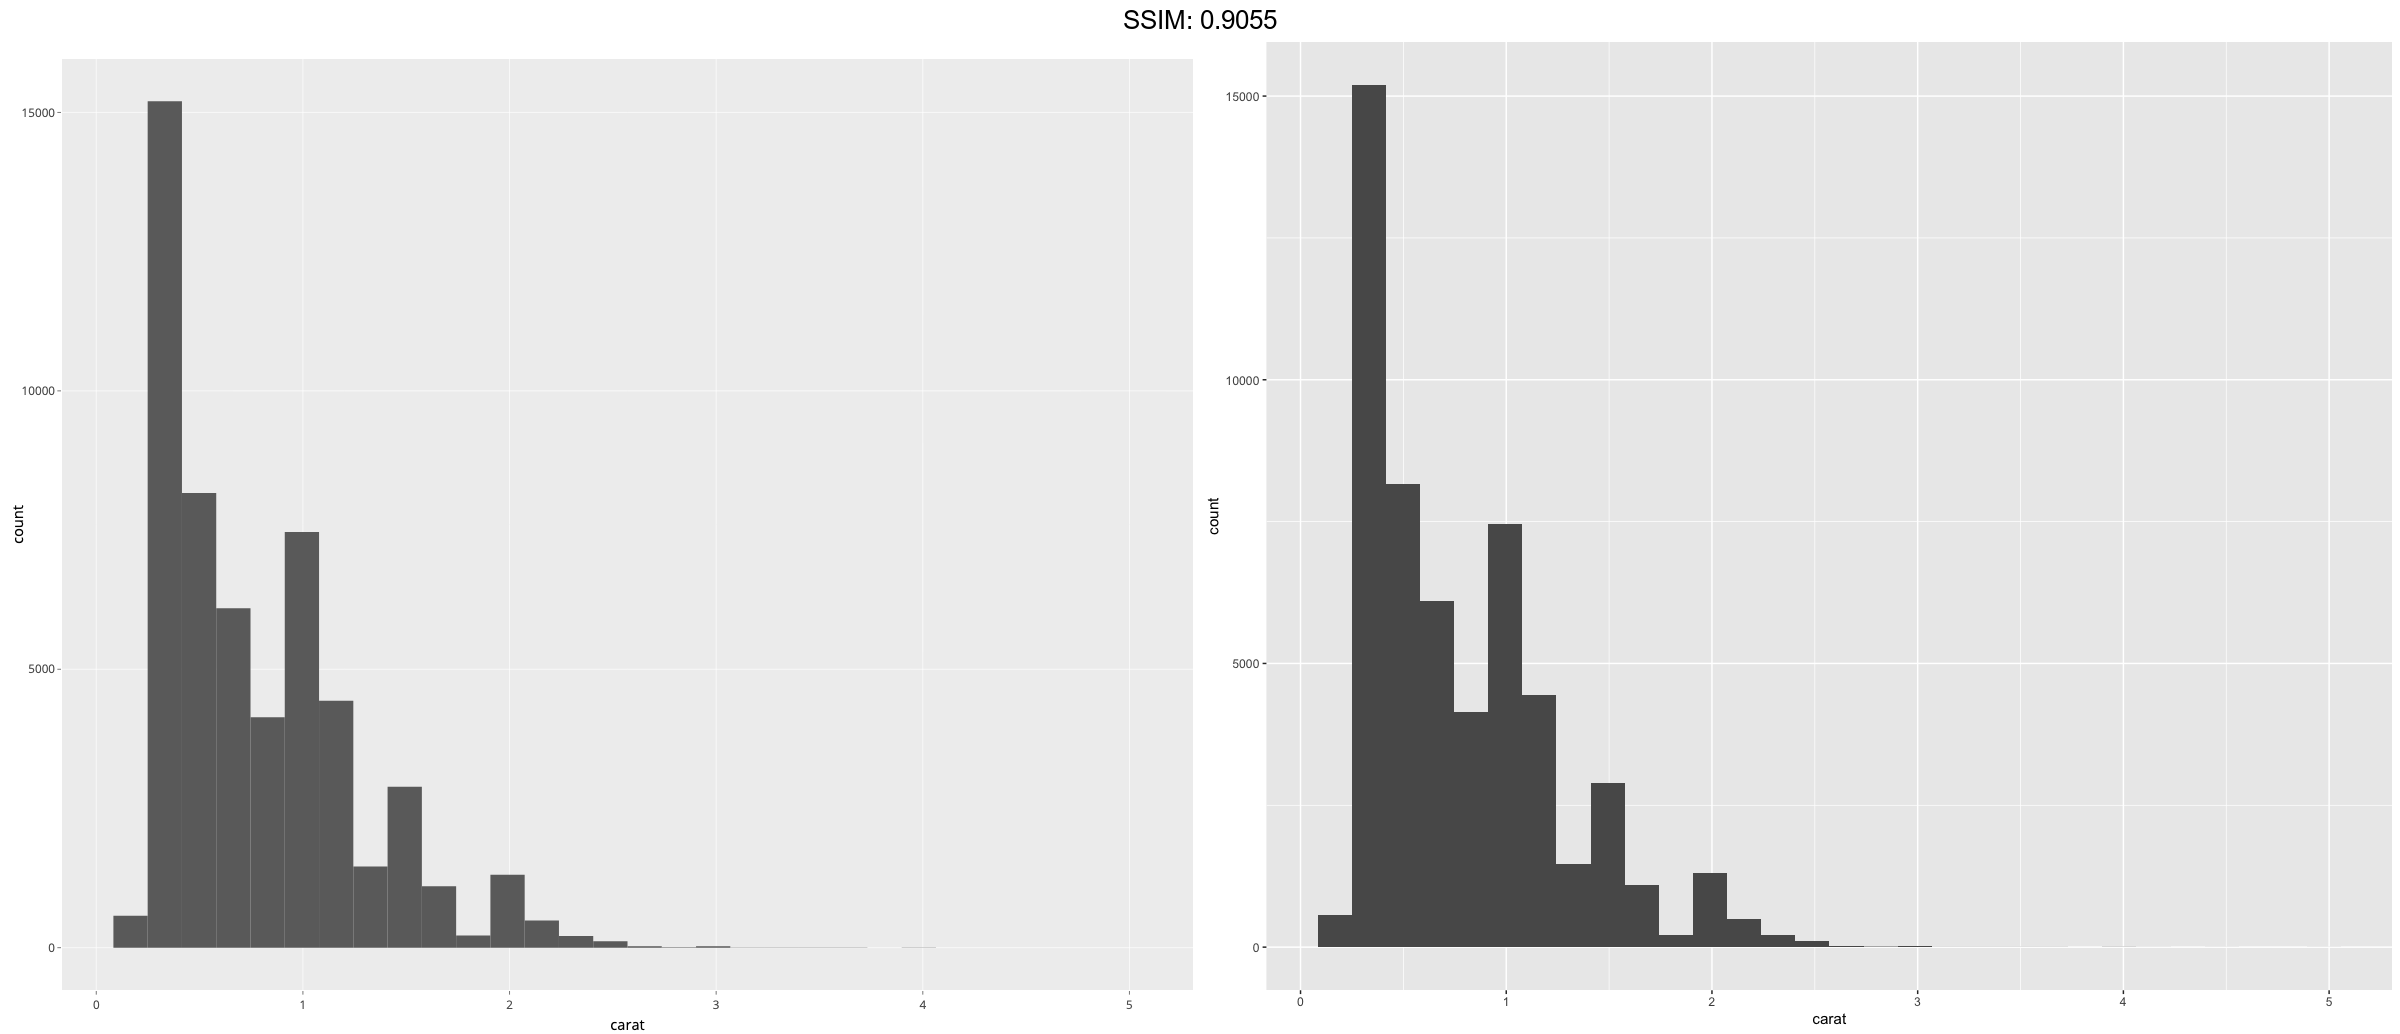
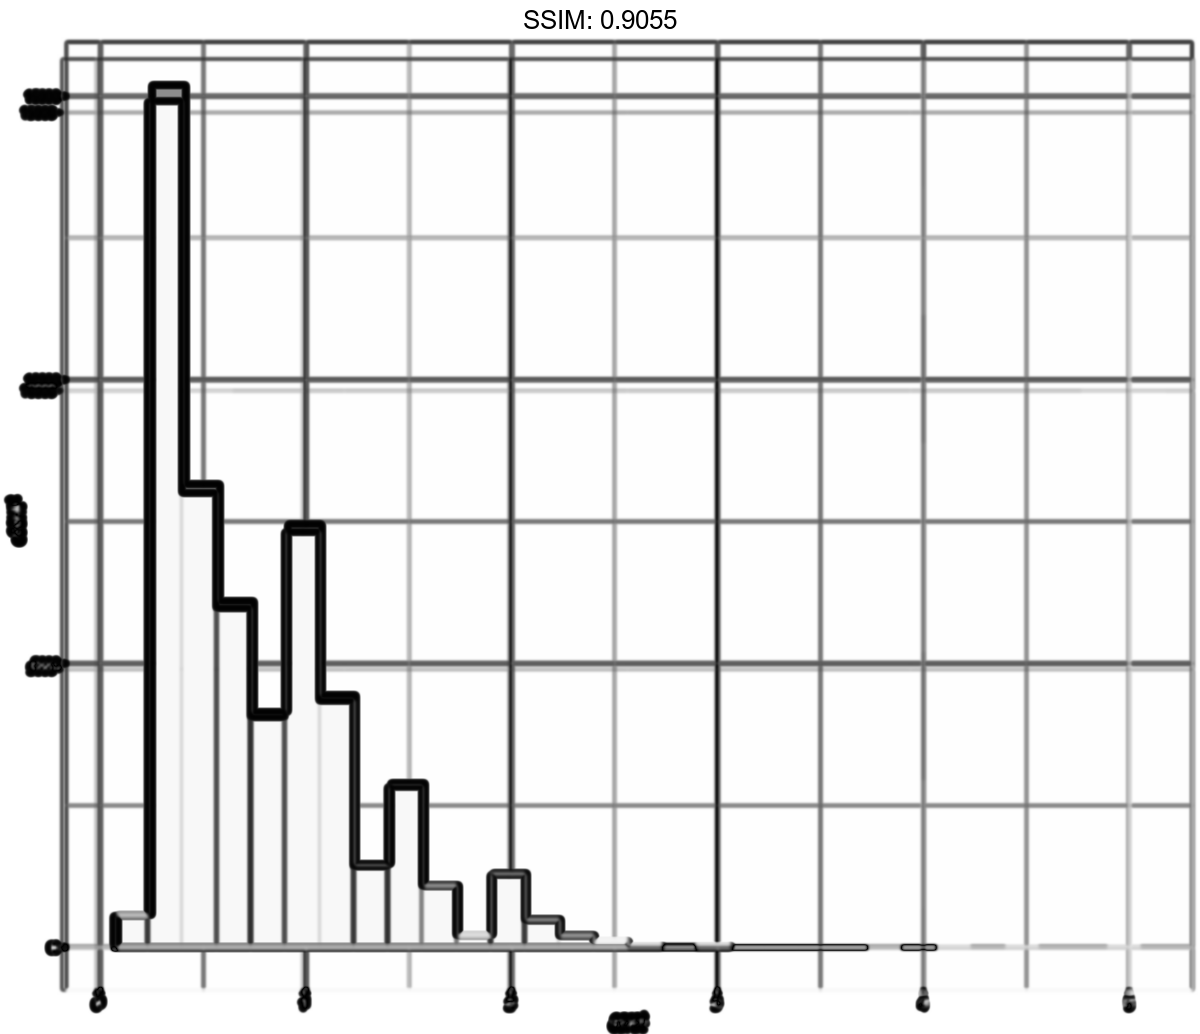
h <- ggplot(diamonds, aes(carat)) +
  geom_histogram()
plotly::ggplotly(h)
## `stat_bin()` using `bins = 30`. Pick better value with `binwidth`.

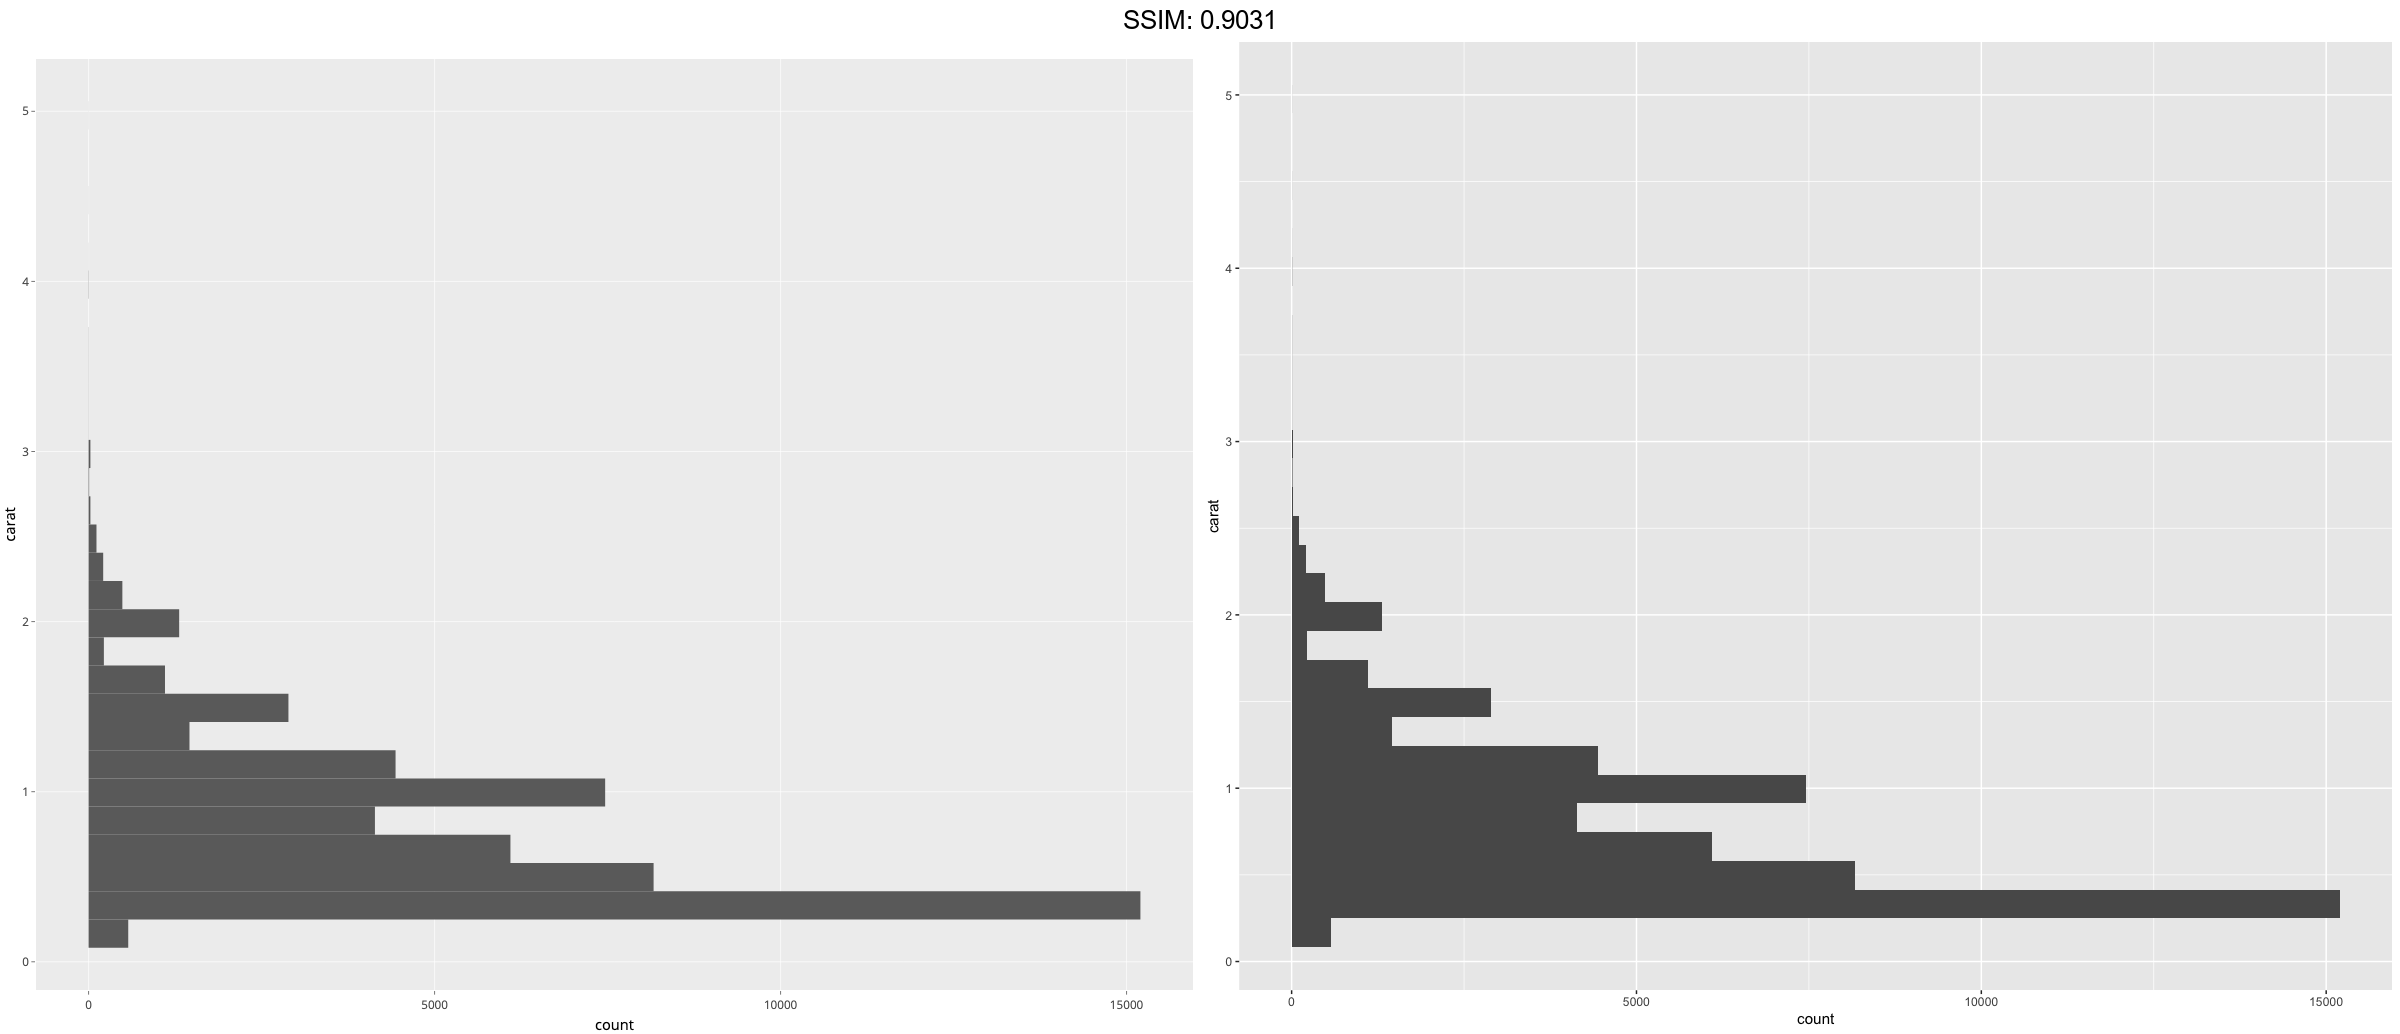
h <- ggplot(diamonds, aes(carat)) +
  geom_histogram()
p <-  h + coord_flip()
plotly::ggplotly(p)
## `stat_bin()` using `bins = 30`. Pick better value with `binwidth`.

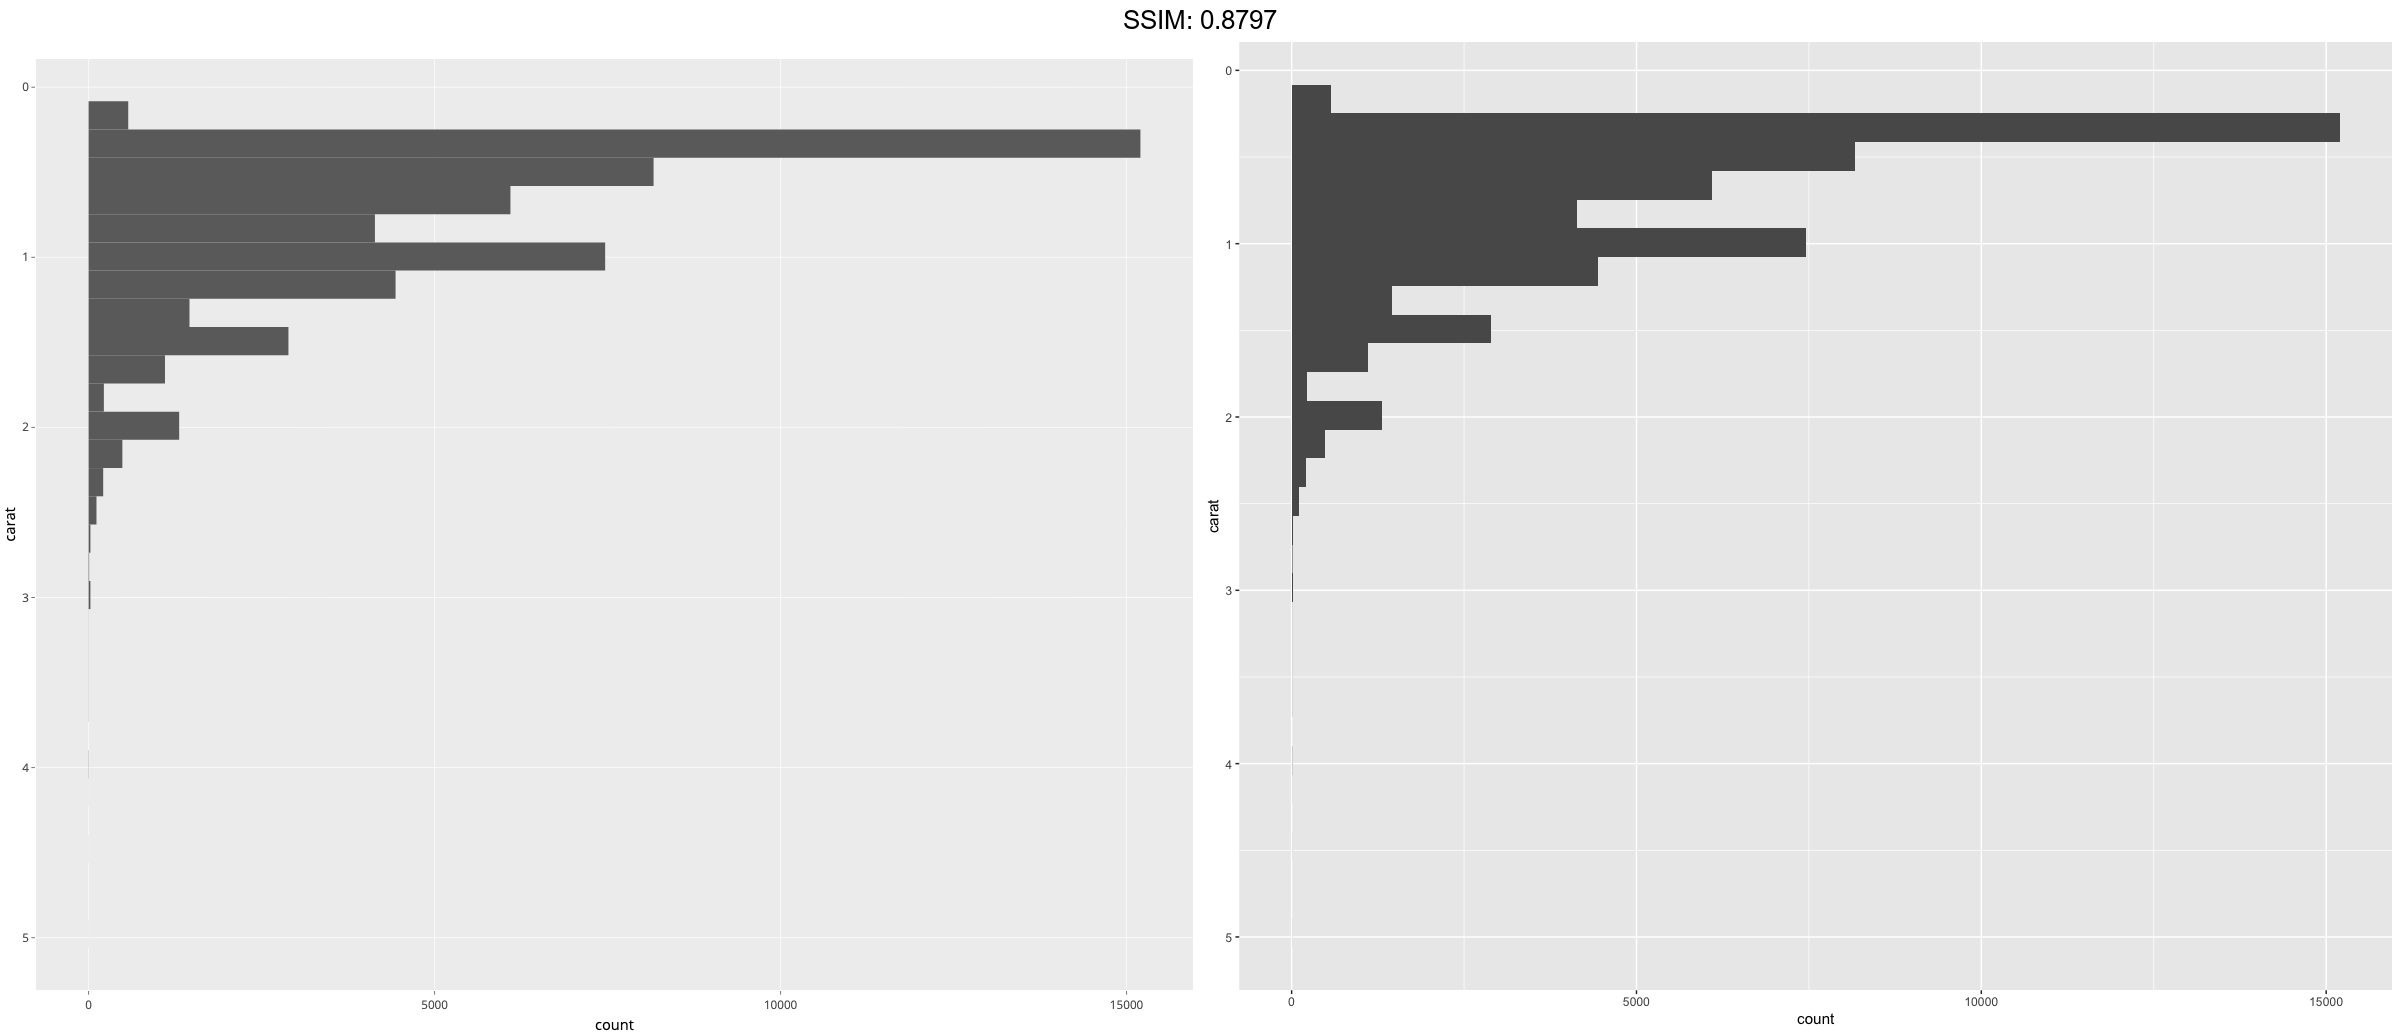
h <- ggplot(diamonds, aes(carat)) +
  geom_histogram()
p <-  h + coord_flip() + scale_x_reverse()
plotly::ggplotly(p)
## `stat_bin()` using `bins = 30`. Pick better value with `binwidth`.

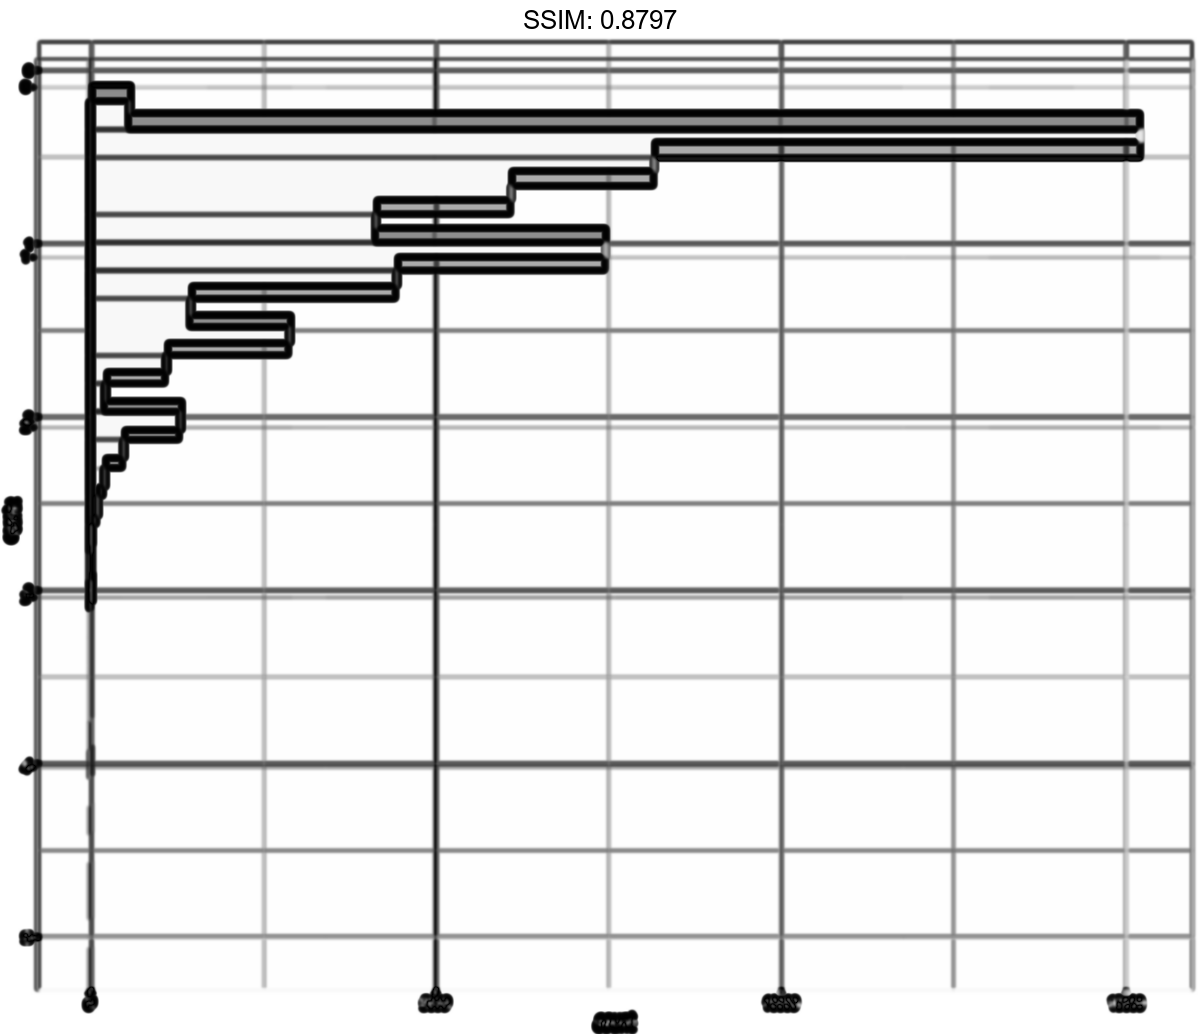
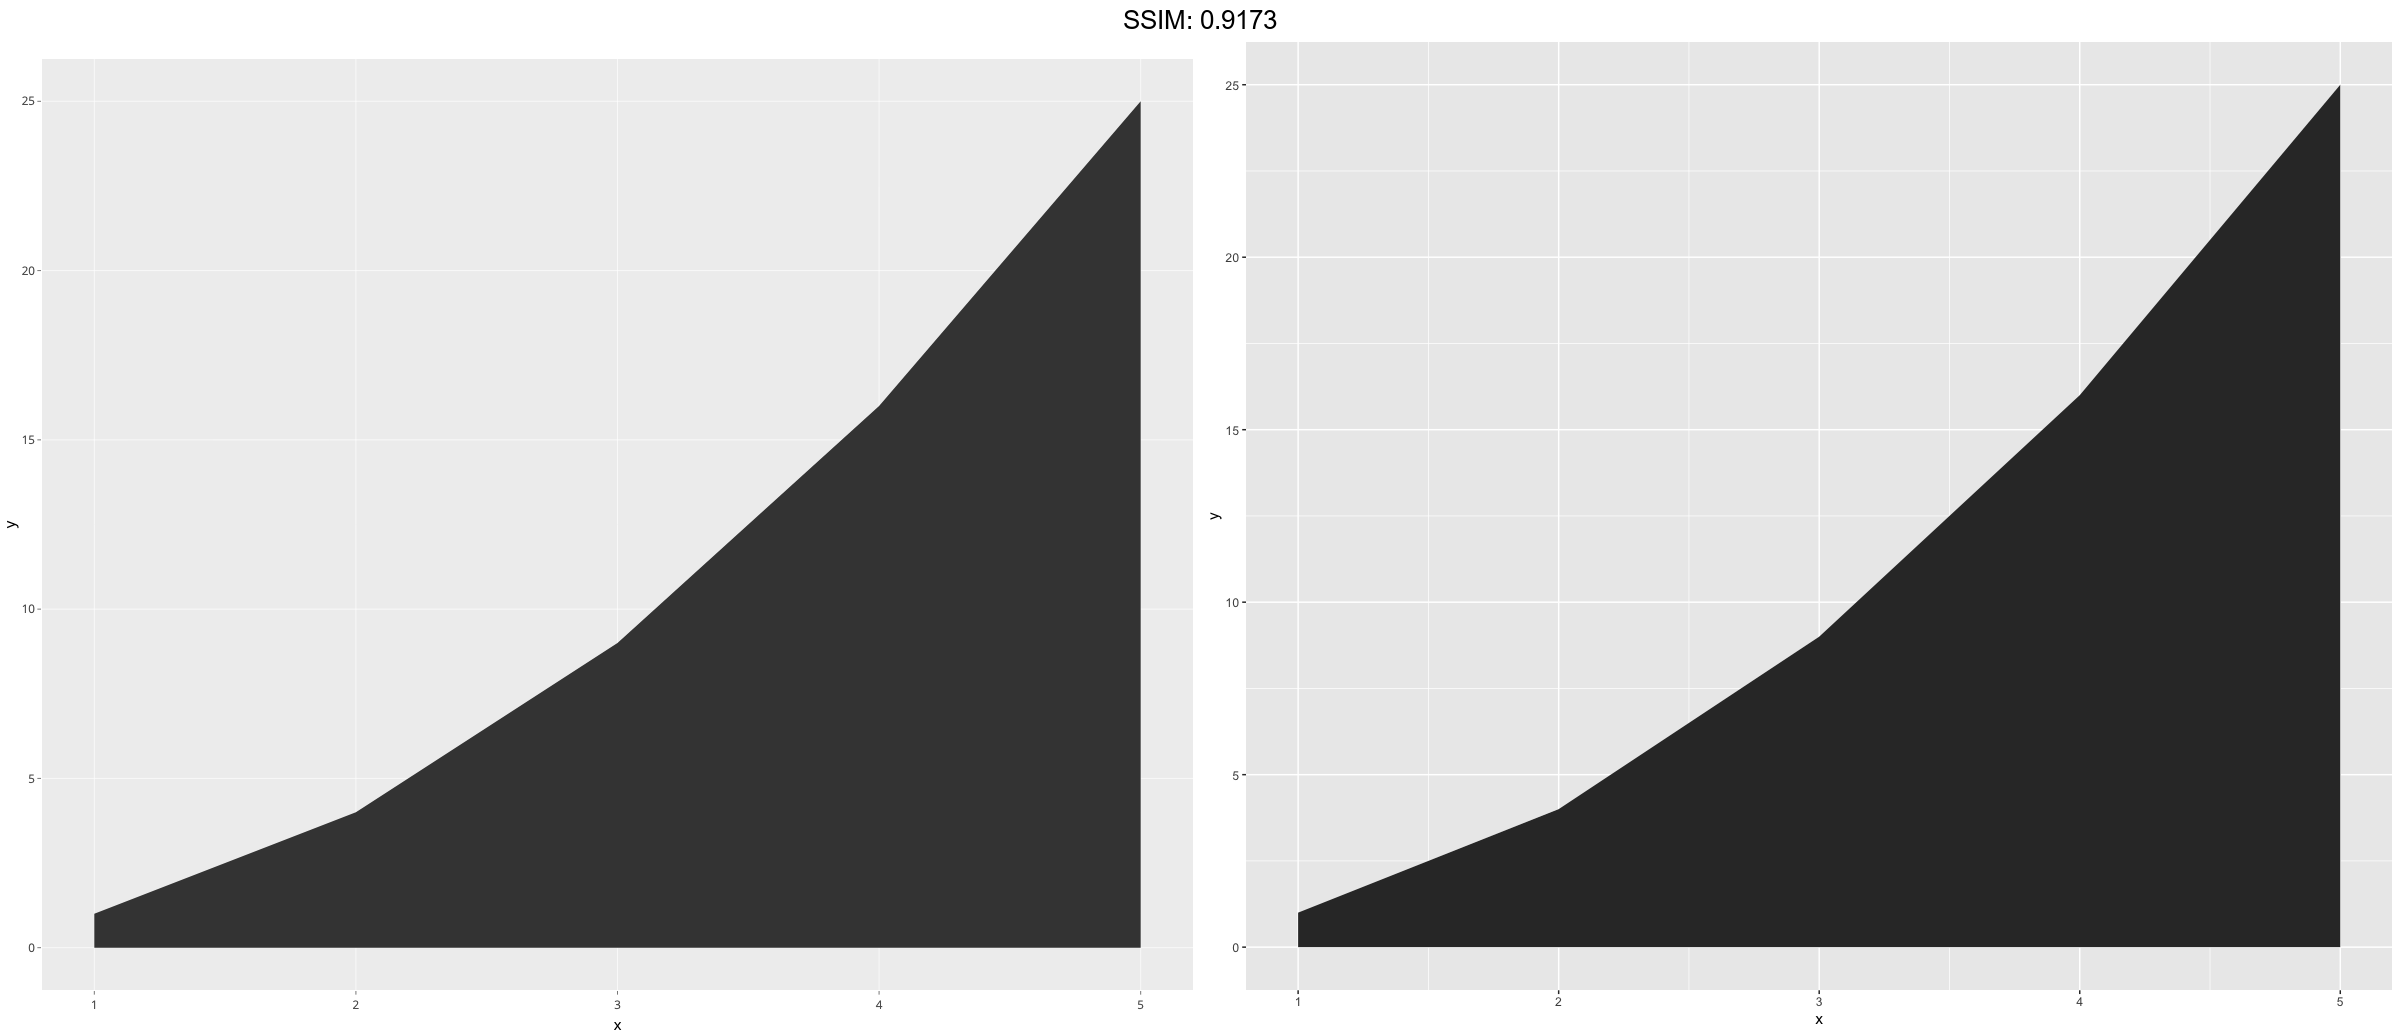
df <- data.frame(x = 1:5, y = (1:5) ^ 2)
p <-
 ggplot(df, aes(x, y)) +
  geom_area()
plotly::ggplotly(p)


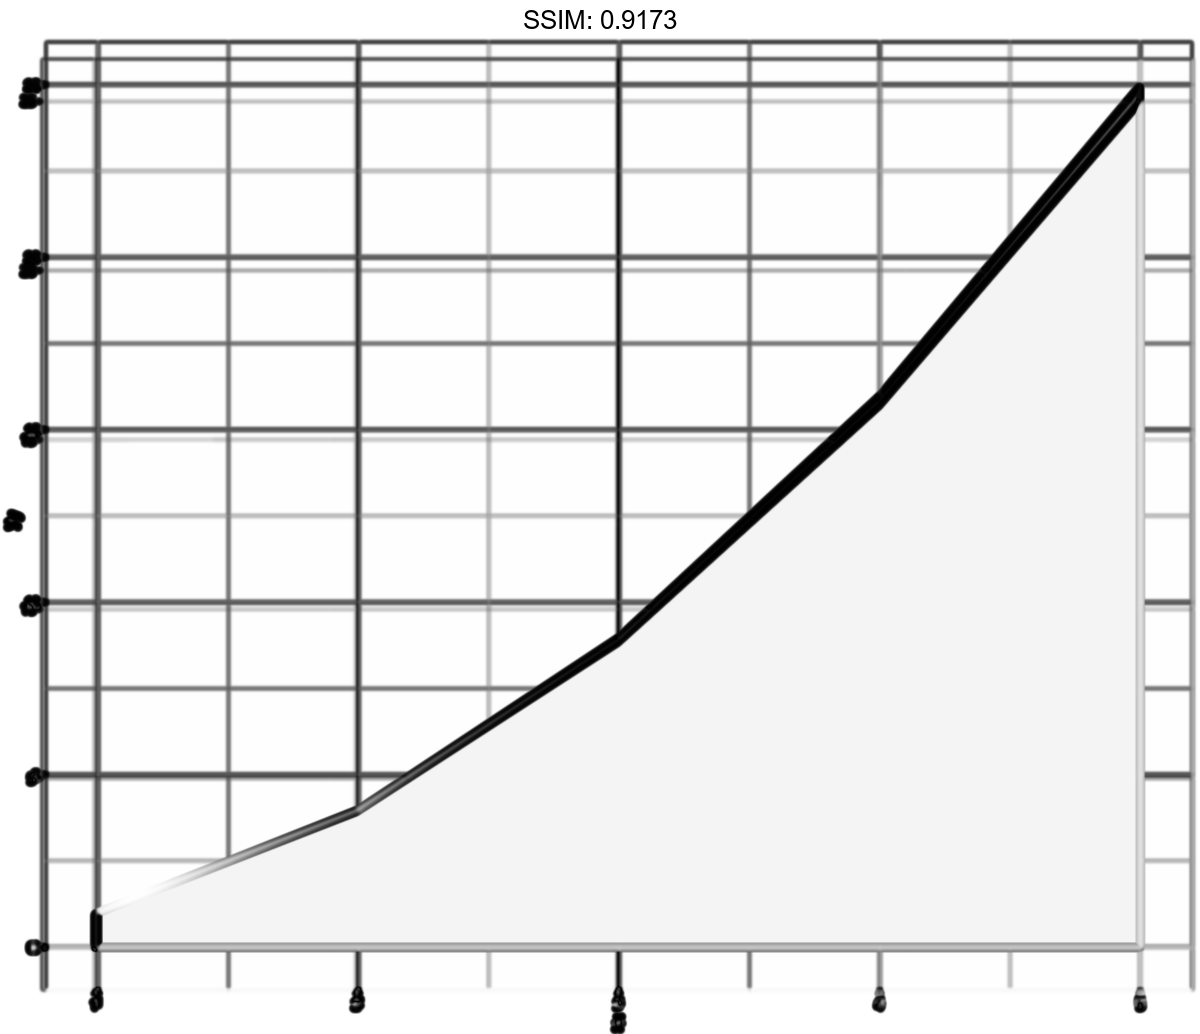
df <- data.frame(x = 1:5, y = (1:5) ^ 2)
p <-
 ggplot(df, aes(x, y)) +
  geom_area()
last_plot() + coord_flip()
plotly::ggplotly(p)

